Blog
What is Trading Volume?
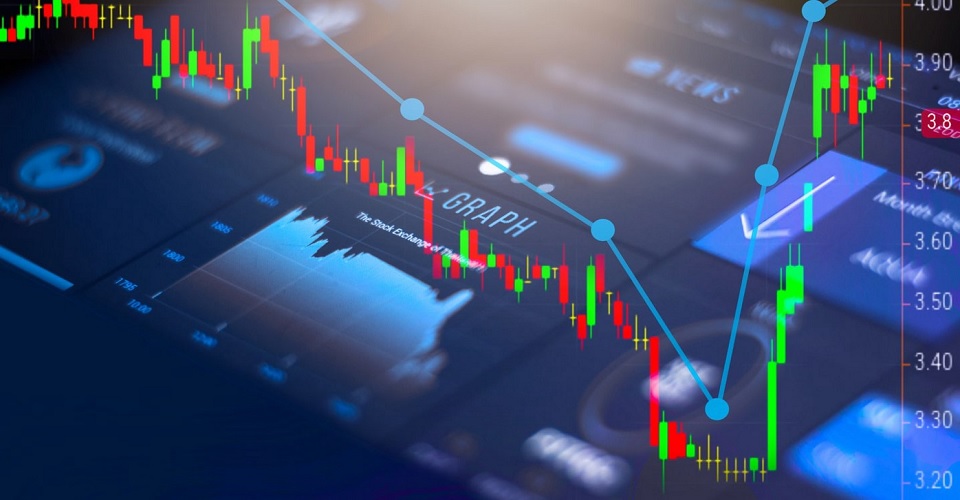
Trading volume, or volume of trade is the measure of completed trades for a particular security over a specified period. Simply put, it is the number of transactions made.
Carrying out volume analysis is considered as being quite important as it is a way of measuring the strength of a market indicator as well as the level of interest in a particular security at the current price. Technical analysis involves volume analysis and it is also used for charting tools such as the Klinger Indicator and the On Balance Volume.
The main factors outlined by the volume of trade are the market activity and the liquidity, and needless to say these are both important for a trader.
With every transaction that takes place, the volume of trade is going to increase. All exchange markets keep track of trading volume, with many reporting them on an hourly basis, and at the end of the day too.
When trading volume is high, trading activities are evidently high. So there are several traders who are buying and selling various quantities of securities, and this is being affected by the fact that several other traders are also doing the same.
Buyers will have more control when prices are pushed higher. on the other hand, sellers will have more control when the prices are being pushed down. The bid price is that point at which the selling volume ensues while the bid is at the highest price being offered by the buyers. When stock is sold at the bid price, it is an indication that sellers are not interested in that stock and the selling volume then starts to increase.
Tracking the trading volume is quite simple. It appears along the lower part of the stock price chart, through vertical bars. These help traders analyse measures of shares which are being bought and sold within a particular period of time. These bars are red and green in colour. The red indicate the declining prices and the volume during that particular period is the selling volume. The green bars indicate the rising prices during that time period, and this is the buying volume. Bar chart analysis is helpful for traders to ascertain price movements.
Volume of trade is considered to be one of the prime indicators in technical analysis. In a nutshell:
- It helps to measure the importance of market movements. The higher the volume, the higher the significance of the price movement, and vice versa.
- It is also a way of indicating the strength of a security.
- Most traders will engage in transactions on the basis of their trading volume.
- Traders also use it to look for reversals of trends in the market.
Carrying out volume analysis is considered as being quite important as it is a way of measuring the strength of a market indicator as well as the level of interest in a particular security at the current price. Technical analysis involves volume analysis and it is also used for charting tools such as the Klinger Indicator and the On Balance Volume.
The main factors outlined by the volume of trade are the market activity and the liquidity, and needless to say these are both important for a trader.
With every transaction that takes place, the volume of trade is going to increase. All exchange markets keep track of trading volume, with many reporting them on an hourly basis, and at the end of the day too.
When trading volume is high, trading activities are evidently high. So there are several traders who are buying and selling various quantities of securities, and this is being affected by the fact that several other traders are also doing the same.
Buyers will have more control when prices are pushed higher. on the other hand, sellers will have more control when the prices are being pushed down. The bid price is that point at which the selling volume ensues while the bid is at the highest price being offered by the buyers. When stock is sold at the bid price, it is an indication that sellers are not interested in that stock and the selling volume then starts to increase.
Tracking the trading volume is quite simple. It appears along the lower part of the stock price chart, through vertical bars. These help traders analyse measures of shares which are being bought and sold within a particular period of time. These bars are red and green in colour. The red indicate the declining prices and the volume during that particular period is the selling volume. The green bars indicate the rising prices during that time period, and this is the buying volume. Bar chart analysis is helpful for traders to ascertain price movements.
Volume of trade is considered to be one of the prime indicators in technical analysis. In a nutshell:
- It helps to measure the importance of market movements. The higher the volume, the higher the significance of the price movement, and vice versa.
- It is also a way of indicating the strength of a security.
- Most traders will engage in transactions on the basis of their trading volume.
- Traders also use it to look for reversals of trends in the market.